

to Poorna Pal's Pages at the Glendale Community College

Ocean 115: Physical Oceanography
Updated on 05.05.2015
|
|
|
to Poorna Pal's Pages at the Glendale Community College |
|
||
|
Ocean 115: Physical Oceanography |
|||||
|
Updated on 05.05.2015 |
|||||
| Home | My Book | Physical Geol: Geol-101, Geol-111 | Environmental Geol: Geol-102, Geol-112 | Oceanography: Ocean-115, Ocean-116 |
|
Talking Points |
|
||
 |
Earth's oceans |
||
|
|||
|
|
||
|
|||
|
Why seasons? Earth's spin axis tilts 23.5° from the vertical. Thus, as Earth completes is orbit, North pole tilts towards the Sun one-half the time, with peak at the Summer Solstice, whereas South pole tilts towards the Sun during the other half, with peak at Winter Solstice. Tropics, bounded by Tropic of Cancer (23.5°N) and Tropic of Capricorn (23.5°S), receive Sun all year round and therefore have no seasons, whereas temperate latitudes have seasons. Also, the northern temperate region (23.5°N to 66.5°N or the Arctic Circle) has summer when the southern temperate region (23.5°S to 66.5°S or the Antarctic Circle) has winter, and vice versa. What if Earth's spin axis became nearly vertical, as is the case with Venus? Will we still have the seasons?
|
||||||||
|
|
||||||||
 |
|
|||||||
 |
|
|||||||
|
||||||||
 |
|
|||||||
|
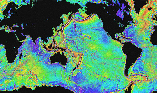
 This map shows how many hours it would take for a tsunami generated anywhere on the rim of the Pacific basin to reach Hawaii. The dots indicate the locations of earthquakes that have generated tsunamis which have affected Hawaii. |
|||||||
|
||||||||
 |
|
|||||||
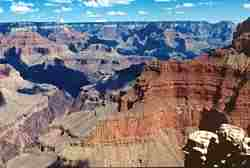 The presence of ~250 Ma old Kaibab limestones in the Grand Canyon suggests that an ocean existed at this location ~250 Ma ago. |
|
|||||||
|
|
||||||||
|
|
|||||||||||
|
|
|||||||||||
|
 |
|||||||||||
|
||||||||||||
|
How do we know that the hydrological cycle
has a 200-250 Ma life-span?
|
|||||||||||
|
|
 |
Why Venus and Mars lack Water?
|
||||||||||
Distance from the Sun is not the reason why Venus and Mars lack water, because the surfaces of all the three planets receive similar amounts of insolation (incoming Solar radiation). The reason lies in their dissimilar atmospheres and the lack of plate tectonism.
As for their atmospheres, note the following facts:
The atmospheres of Venus and Mars are carbon-rich, with ~90% CO2. Earth's present-day
atmosphere is significantly different, and contains only ~0.035% C, but had about the same
CO2 once upon a time as the venusian atmosphere today.The densities of the three atmospheres are significantly different, however ― Venusian
atmosphere is ~90 times thicker than Earth's atmosphere whereas the latter is ~90 times
thicker than the Martian atmosphere!
As for plate tectonics, there is no evidence that either Venus or Mars ever experienced this activity.
|
|
||||
|
|
Earth's atmosphere reflects ~32% of this insolation away, so letting only ~930 W/m2 of this solar heat reach the surface. The thick venusian atmosphere reflects away ~76% of this insolation, and what reaches its surface is barely 630 W/m2. Clearly, proximity to the Sun is not the reason why Venus is so hot. Rather, it should be colder than the Earth!
Why is Venus so hot then? Two reasons have contributed to it:
Venus is a slow and retrograde rotator. It completes one spin on its axis in 243 earth days, spinning in a direction opposite to the other planets (i.e., Sun rises in the west there, not in the east), and completes one orbit about the Sun in 223 earth days. One side of the planet thus faces Sun almost 80% of the time.
The thick venusian atmosphere then retains and evenly distributes the solar heat thus absorbed by the planet, so leaving the "day" and "night" sides of Venus almost equally hot.
Was the Earth just as hot as Venus once upon a time, then, when Earth's atmosphere was as rich in CO2 as present venusian atmosphere? Probably not, when we note that much of the volcanism on Earth has been expended in creating the seafloor (i.e., associated with plate tectonism) whereas venusian volcanism is of the plume-type (i.e., the kind we find in Hawaii). The volatiles released by the former are more likely to stay in the lower atmosphere than go to the upper atmosphere whereas the opposite is likely to be true of those released by the latter.
|
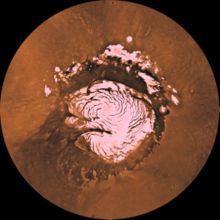
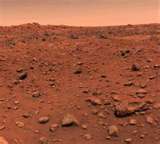
The Northern Polar Icecap on Mars
Martian landscape |
As for the hydrological cycle on Mars, there is good evidence that water was once abundant enough on Mars to have produced the landscape we now see but now remains confined to the subsoil and the polar ice cap. The question, then, is as to how and why might Mars have lost its hydrological cycle.
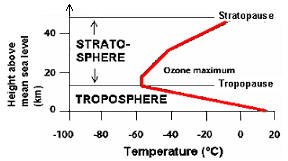
A good chance is that Mars is too small to have had a strong enough gravitational field that would have prevented water from escaping into the space. It is not that Martian atmosphere is not thick enough ― the total quantity of CO2 in the Martian atmosphere greatly exceeds that in the Earth's atmosphere, after all. It is just that the planetary atmosphere must have some mechanism to prevent the escape of water into the outer space. Unfortunately, though, appealing to low density of Martian atmosphere to argue that its temperature gradient is too gentle to have prevented the escape of atmospheric moisture (unlike Earth’s tropospheric thermal gradient that is steep enough to have retained the hydrological cycle), ignores the fact that a vigorous hydrological cycle may have once existed on Mars.
There is also some evidence that plate tectonics once occurred on Mars, but no longer does. The question is whether the striped magnetic anomalies reported on Mars that seem so similar to those seen on Earth's oceans indeed provide the evidence of now defunct but once active Martian plate tectonics. Also, if indeed so, the question is whether these anomalies formed 4 Ga ago or about 1000 Ma ago. We could nonetheless claim that Mars lacks hydrological cycle because it no longer has the plate tectonics to create new ocean basins to replace the ones flattened by the “run-off” component of hydrological cycle.
The presence of hydrological cycle on the Earth, and its absence on Mars, is therefore due as much to the planetary atmospheres as to plate tectonics, much as the case is with Venus.
 |
|
or click on this map on the right to access the World Map of Volcanoes, Earthquakes, Impact Craters, and Plate Tectonics.
Try this "Topography of the ocean floor" exercise at the URL: http://gyre.umeoce.maine.edu/physicalocean/Tomczak/IntExerc/basic2/quest02.html
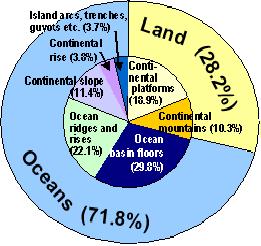
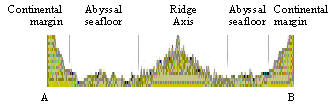
A peculiarity of the heights and depths on Earth's surface is their bimodal distribution, seen in the hypsometric graph below.
Clearly, even if all the waters on the Earth disappear, whether as moisture in the atmospheric or in the polar icecaps, oceans would still show up as deep basins!
Overall, these basins (colored blue in the above hypsometric graph) can be grouped as (a) continental margins and (b) deep ocean basins. Of these:
continental margins (a) can be active (i.e., seismic or tectonic) or passive (i.e., aseismic);
(b) comprise ~14% of the oceanic area, with ~740 m average depth; and (c) carry ~52% of the world's sediments (thickness <7 km) that are mostly brought by run-off from land; anddeep ocean basins (a) cover ~85% of the ocean surface and (b) comprise (i) abyssal seafloor (~80% of ocean surface, ~4.5 km average depth, ~13% of world's sediments averaging ~200 m in thickness), (ii) ridges and rises (e.g., the Mid-Atlantic Ridge, East Pacific Rise etc., that cover ~6% of ocean surface, have ~2.5 km average depth, and carry ~7% of the world's sediments), and (iii) deep sea trenches and island arcs (~1% of ocean surface and ~6.5 km average depth).
The Geology of the Seafloor
Bathymetric, magnetic and stratigraphic profiles across the submarine ridges and rises tend to be symmetric, as can be seen from the example of Mid-Atlantic Ridge alongside.
The ridge axes also have high seismicity, high heat flow, and symmetric magnetic anomalies.
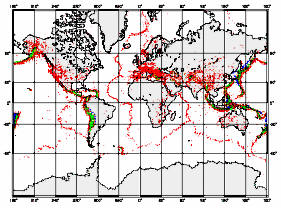
Shown below is a map of the ridges and rises worldwide, for instance. See how well their locations correlate with the world seismicity map. Get the world seismicity map by clicking on this image
.
Marine magnetic anomalies have perhaps provided the most information on seafloor and how it has been created. Typical of the magnetic profiles obtained over mid-ocean ridges is the observation of alternate rises and falls. As the seafloor is basaltic, these marine magnetic stripes are the records of geomagnetic field's polarity reversals as the lavas extruded. Click on this image alongside to learn
about how these anomalies are mapped
and what they actually mean in terms
of the seafloor's history of evolution.
This has enabled the detailed mapping of seafloor ages. Clicking on the map below will enable you to view and download the original digital map of ocean floor ages from the NGDC (National Geophysical Data Center).
|
|
|||
|
|
Read this USGS Open-File Report 99-132 (On-Line Edition) by John C. Lahr that describes how to build a model of the outer 300 km (180 miles) of the Earth that can be used to develop a better understanding of the principal features of plate tectonics, including sea-floor spreading, the pattern of magnetic stripes frozen into the sea floor, transform faulting, thrust faulting, subduction, and volcanism.
North Cascades Geology: Sea-Floor Spreading:
Try this USGS page to compare magnetic stripes on the sea floor to the magnetic reversals in basalt on the land as seen in a vertical cliff and explains how this supports the sea floor spread model.
 |
|
|||||||||
|
||||||||||
|
||||||||||
|
||||||||||
|
|
|||||||||
|
||||||||||

Watch this video about earthquakes on HowStuffWorks. The 1906 earthquake is one of the strongest in California's history and geologists are learning more and more about how the earth's mantle shifts and squeezes, ultimately resulting in earthquakes.
|
|
 |
 |
|
divergent plate boundaries are where new surface is created, by way of seafloor spread ― these are the mid-ocean ridges and rises; whereas the convergent plate boundaries are those where the existing surface is destroyed, as at the folded mountain belts and deep sea trenches.
|
|
|
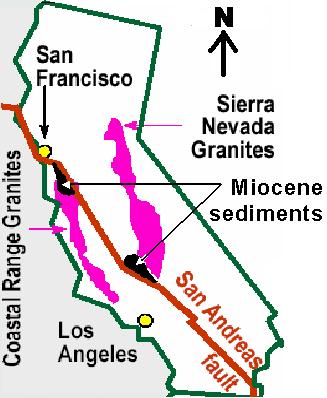
Computing the displacement rate If you think that the sluggish geological processes are hard to measure on human timescales, think again. Look at the displacement of Miocene sediments (say about 25 Ma in age) on the two sides of the San Andreas Fault, by say about 600 km. This implies a displacement at the rate of
This approximately 1 cm/yr rate is easy to verify by physical observations and suggests that you need to wait another 25 Ma before UCLA and UC Berkeley can possibly become immediate neighbors! |
|||||||
|
|||||||||
 |
|
|
|
||
|
||
|
||||||||
|
 |
|||||||
 |
The map alongside shows the South |
|||||||
|
The graph below compares these magnetic ages with the fossil-based or paleontological ages of the oldest sediments drilled at the Leg 3 sites 14 through 21. Note the excellent correlation between the two independently determined age data. These data themselves are tabulated below. |
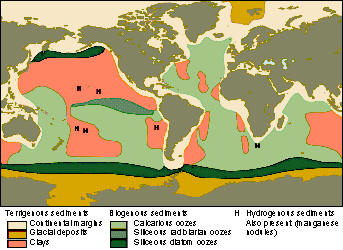
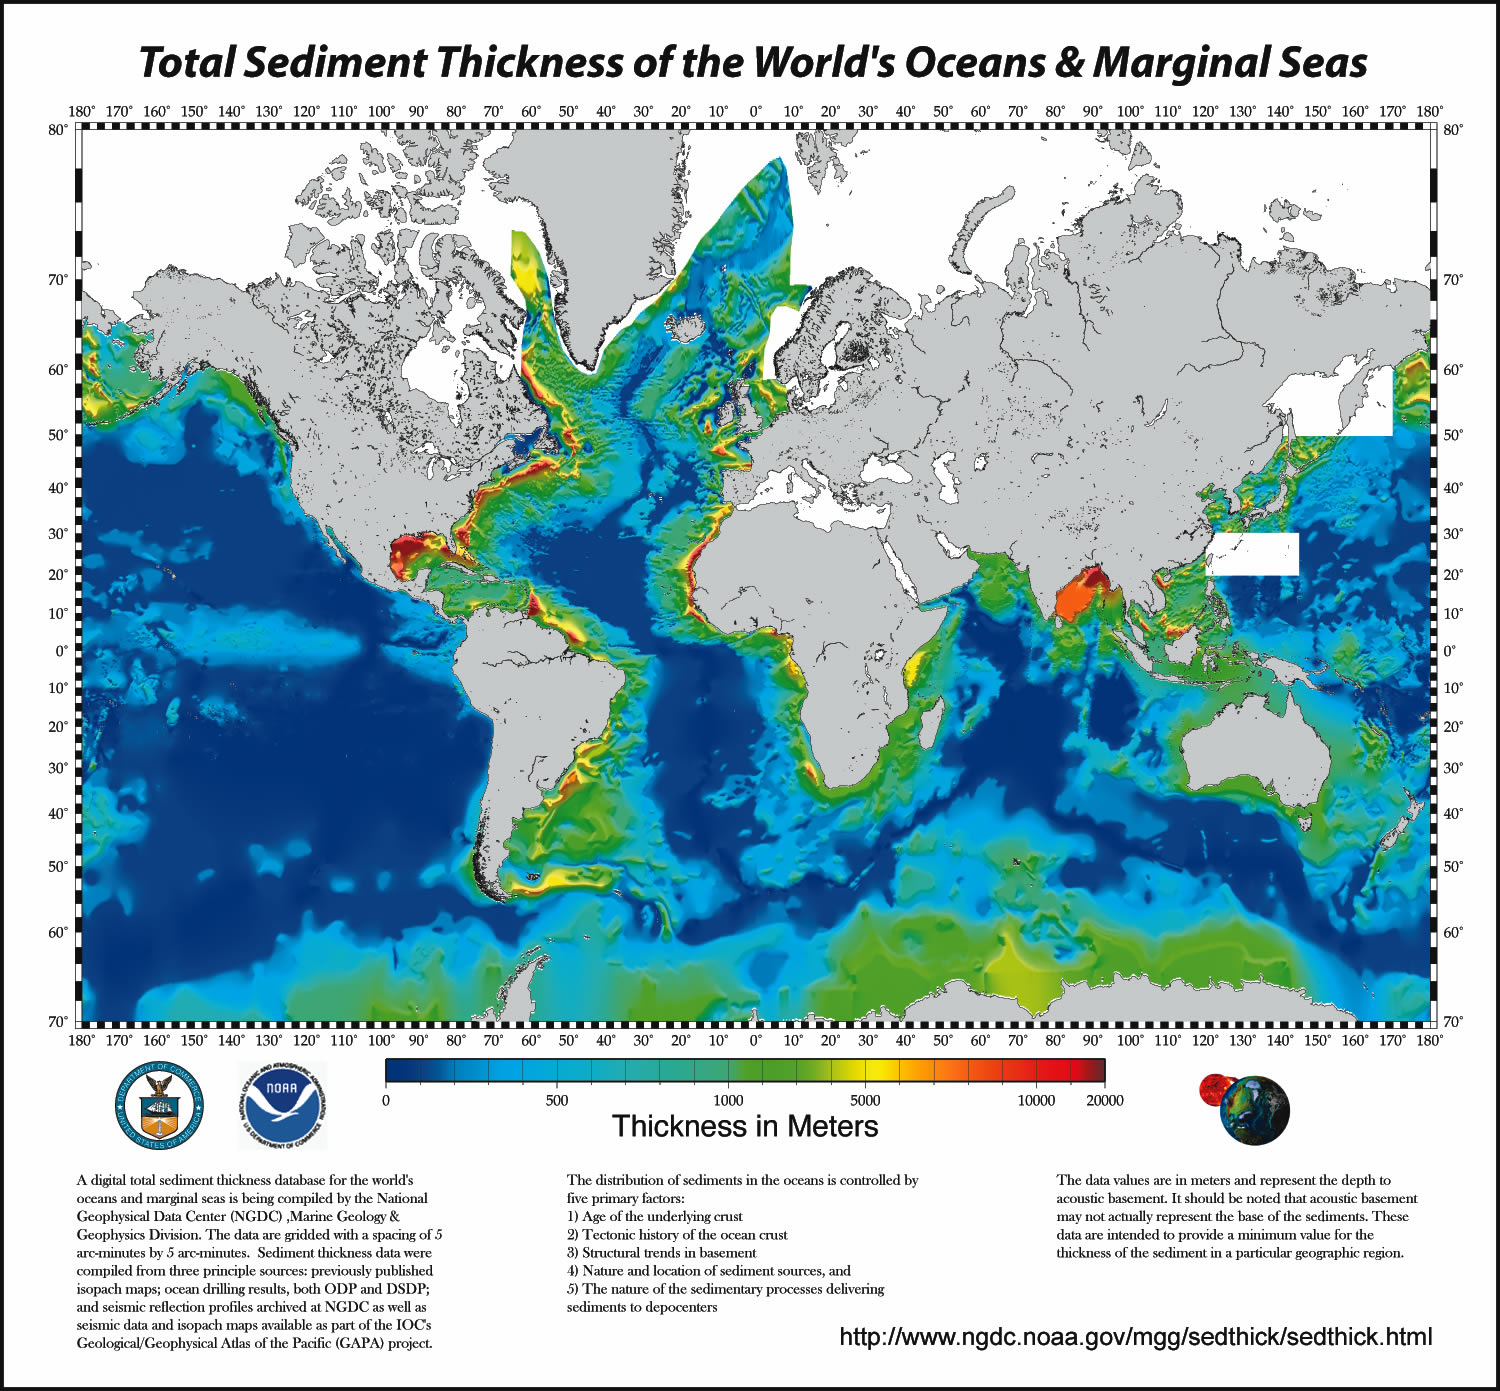
The total thickness of marine sediments The map below shows the total thickness of world's marine sediments, as estimated from the seismic and deep sea drilling studies. They yield an average thicknesses of ~900 m over the entire ocean, shallow and deep (deep oceans have a substantially thinner layer, as almost 80% of these sediments are found on the continental margins). |
|||||||
|
For the 361 million km2 total surface of the world ocean, this yields a total volume of 325 million km3. For an average sediment density of 2300 kg/m3, this means a total mass of about 750 x 1015 metric tons for all the marine sediments. At the hydrological cycle's annually averaged rate of depositing 15 million tons of sediments into the oceans, this means that all these sediments have taken about 50 Ma to pile up! |
||||||||
 |
|
|||||||
|
This ~50 Ma estimate of the time needed for present marine sediments to pile-up is barely a quarter the 200 Ma that we found earlier as the time that run-ff part of the hydrological cycle needs to fill the ocean basins. But this is only to be expected. Note that the process is a dynamic one. New surface is continually being created, after all, as the existing one is lost. |
|
|||||||
|
|
|
Download this map at http://www.ngdc.noaa.gov/mgg/image/sedthick9.jpg |
||||||
 |
|
|||||||
 |
Seawater
Chemistry
|
|
||||||
 There are over 300 million trillion gallons of water on earth ― if we divided it evenly, each person would have 40 billion gallons to themselves. To learn more about water and it's amazing properties, check out this HowStuffWorks video: How Water Works. |
||||||||
|
|
||||||
|
Oxygen’s
atomic number = 8, atomic mass = 16. |
|||||||
| Hydrogen (H) |
Visit the URL: http://web.jjay.cuny.edu/~acarpi/NSC/3-atoms.htm to learn more about the atoms and atomic structure. These animations on the left, taken from this website, illustrate the structures of two hydrogen isotopes, hydrogen (atomic number = 1, atomic weight = 1) and deuterium (atomic number = 1, atomic weight = 2). Tritium is another hydrogen isotope, not shown here, with atomic number = 1 and atomic weight = 3. Here, red denotes protons, blue the neutrons and gray electrons. Note that the hydrogen isotope lacks a neutron: it is basically a proton in the nucleus about which a single electron orbits, whereas the deuterium atom carries one neutron in its nucleus, in addition to the proton of course. |
|||
 |
||||
| Deuterium (2H) | ||||
 |
||||
|
|
|
|
||
| Electron | Proton | Neutron | ||
|
Nuclear Fusion Note that when we argue, following the most widely held view of solar system's evolution that was first proposed by Kant and Laplace, that all the matter evolved from Hydrogen, we are basically talking of the nuclear fusion of deuterium and tritium atoms. Indeed, the nuclear fusion of light elements is the energy source which causes the stars to shine. The animation on the right shows how the helium atom (He, atomic number = 2, atomic weight = 4) forms from the fusion of two deuterium (2H) atoms. |
|
2H |
||||
|
|
||||||
|
= |
||||||
|
|
|
|||||
| 2H |
He |
|||||
|
|
The fusion of how many deuterium atoms would create a carbon atom? nitrogen atom? oxygen atom? |
|
|
||||
|
||||
|
|
|
|||
We humans are littoral creatures, and
therefore inhabit the shorelines, whether seashore, or lakeshore or
riverside, as this map shows. Clearly, we are always affected by, and should
be always concerned about, the processes at the coasts. |
||||
|
Earthquakes and Megacities: This map shows major earthquake epicenters (red dots) and their relationship to world cities (white dots. Notice how well their locations correlate. Why? Use this map to learn about the distribution and frequency of earthquakes, comparing the earthquakes to the distribution of land masses, oceans, and cities/population. What cities are most at risk from earthquakes? How does your own city compare to others in terms of earthquake risk? On this map, over 39,000 earthquakes are shown with more than 8,300 cities. |
 |
Source: http://education.usgs.gov/common/resources/mapcatalog/images/earthquake/world_seismicity.jpg
| Coasts can be |
|
|||||

From the archives of Discovery: Over time, these cliffs are worn down into unique formations. Learn more about cliffs and erosion here. |
||||||
 |
Human modification of the coast
― Construction in the coastal zone may enhance or
otherwise alter the natural processes and their resulting impacts. Roads and
beach-access paths perpendicular to the shore which penetrate the dune line
may become overwash passes or focal points for storm-surge flood or ebb
currents. Seawalls may redistribute wave energy or obstruct sediment
movement. Jetties may block great volumes of sand from being transported
along the coast, resulting in deposition of sand and beach widening on the
updrift side and a long-term sand deficit and erosion on the downdrift side.
Ground-level houses and closed-in ground floors of houses on stilts may
obstruct the passage of overwash sand which is then lost to front-side
erosion. Where vegetation cover has been removed, erosion by wind or water
may occur. |
|
http://coastalhazards.wcu.edu/Libros/libroschapter3.htm |
> Primary producers are the plants that make food usually from sunlight.
> Capture and Flow of Energy:
> Photosynthesis: storing of energy, how it works, the reactions involved, more
common.
> Chemosynthesis: storing of energy, how it works, the reactions involved, less
common.
> Respiration: releasing of energy, how it works, the reaction involved,
> Flow of Matter between Life and Non-life: what matter is involved (O2, CO2,
etc.), how it flows.
> Feeding (trophic) relationships:
> Primary producers (autotrophs) - plants
> Primary consumers and secondary consumers (heterotrophs) - animals.
> Trophic pyramid and food web: what they are and how they are laid out,
producers and consumers.
> Primary productivity: where it is the greatest and the least in the oceans,
where it varies most by season..
> Factors that limit productivity: CO2, water are not limiting factors, sunlight
and nutrients can be.
> Plankton: what is it, phytoplankton vs. zooplankton, global distribution.
> Compensation depth: what is it, how is it related to productivity.
> Large marine producers: algae (primitive plants) vs. marine angiosperms (like
most land plants).
> Algae:
> Nonvascular plants (no vessels): pick up water and nutrients along plant
rather than in roots.
> Accessory pigments: affects absorption of light: other colors than green
better deep in ocean.
> Other colors make algae have more photosynthesis deep in ocean.
> Marine Angiosperms: like "normal" plants - include sea grasses and mangroves.
Chapter 15: Marine Animals
> Beginnings of life up to free oxygen in atmopshere.
> Phylum similarities and major animal phyla (Table 15.1)
> Invertebrates vs Vertebrates - differences, relative numbers.
> Invertebrates:
> For each of major phyla of simplest invertebrates: types of animals and basic
characteristics.
> For each of major phyla of advanced invertebrates: types of animals and basic
characteristics.
> Mollusks: 3 classes of mollusks: types of animals and basic characteristics.
>Arthropods: types of animals and basic characteristics.
> Chordates: types of animals and basic characteristics.
> Echinodermata: types of animals and basic characteristics.
> Vertebrates:
> For each of major phyla of vertebrates: types of animals and
basic characteristics.
> 3 phyla of fishes: types of animals and basic characteristics.
> Amphibeans: why there are basically no marine amphibeans.
> Marine Reptiles: types of animals and basic characteristics.
> Marine birds: types of animals and basic characteristics.
> Marine mammals: types of animals and basic characteristics.
Chapter 16: Marine Communities
> What is a marine community?
> Relationship between community, habitat, and niche.
> What is biodiversity?
> Influence of Physical and Biolgiocal Factors:
> Examples of Physical and Biolgiocal Factors
> Responses of organisms to range of factors - optimal range, etc.
> Competition between organisms: same species, different species, native vs
exotic species.
> Growth rates and limiting factors.
> Distribution of organisms within community: random, clumped, and uniform.
> Changes in communities including climax communities.
> Examples of Marine Communities:
> Basics of each marine community including characteristics and
locations (near Florida?).
> Symbiosis: what it is and the 3 types.
|
n |
· |
Following are examples of coastal erosion by waves: |
||||
|
|
|
|
||||
|
· |
– |
|||||
|
– |
||||||
|
|
|
The example below is that of a delta: |
||||
|
· . |
Deltas
are of three types: |
|
||||

Watch this TED video featuring David Gallo, a leading ocean explorer, as he discusses some of the coolest underwater sea creatures. See how the shape-shifting cuttlefish works, as well as bioluminescent fish that can light up the ocean depths....

 Indeed,
water is hardly common within our own Solar
System itself. Not all of them are Earthlike, anyway. Density,
defined as mass per unit volume, is a measure if their chemical
compositions. Thus examined, the inner planets (Mercury, Venus,
Earth and Mars) are compositionally alike
Indeed,
water is hardly common within our own Solar
System itself. Not all of them are Earthlike, anyway. Density,
defined as mass per unit volume, is a measure if their chemical
compositions. Thus examined, the inner planets (Mercury, Venus,
Earth and Mars) are compositionally alike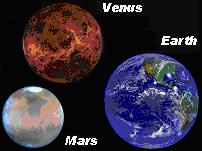


